Original Research
Part of Data-led PR assets
Creating a table journalists can verify
A journalist should be able to read a table and reproduce the claim in the pitch. Provide the values, definitions and source context in a format that survives …
Build the table so a journalist can identify each value, match it to a source and reproduce a reported figure. Keep the data, definitions and source note together when the table is copied into an article or spreadsheet.
Build the table from the claim
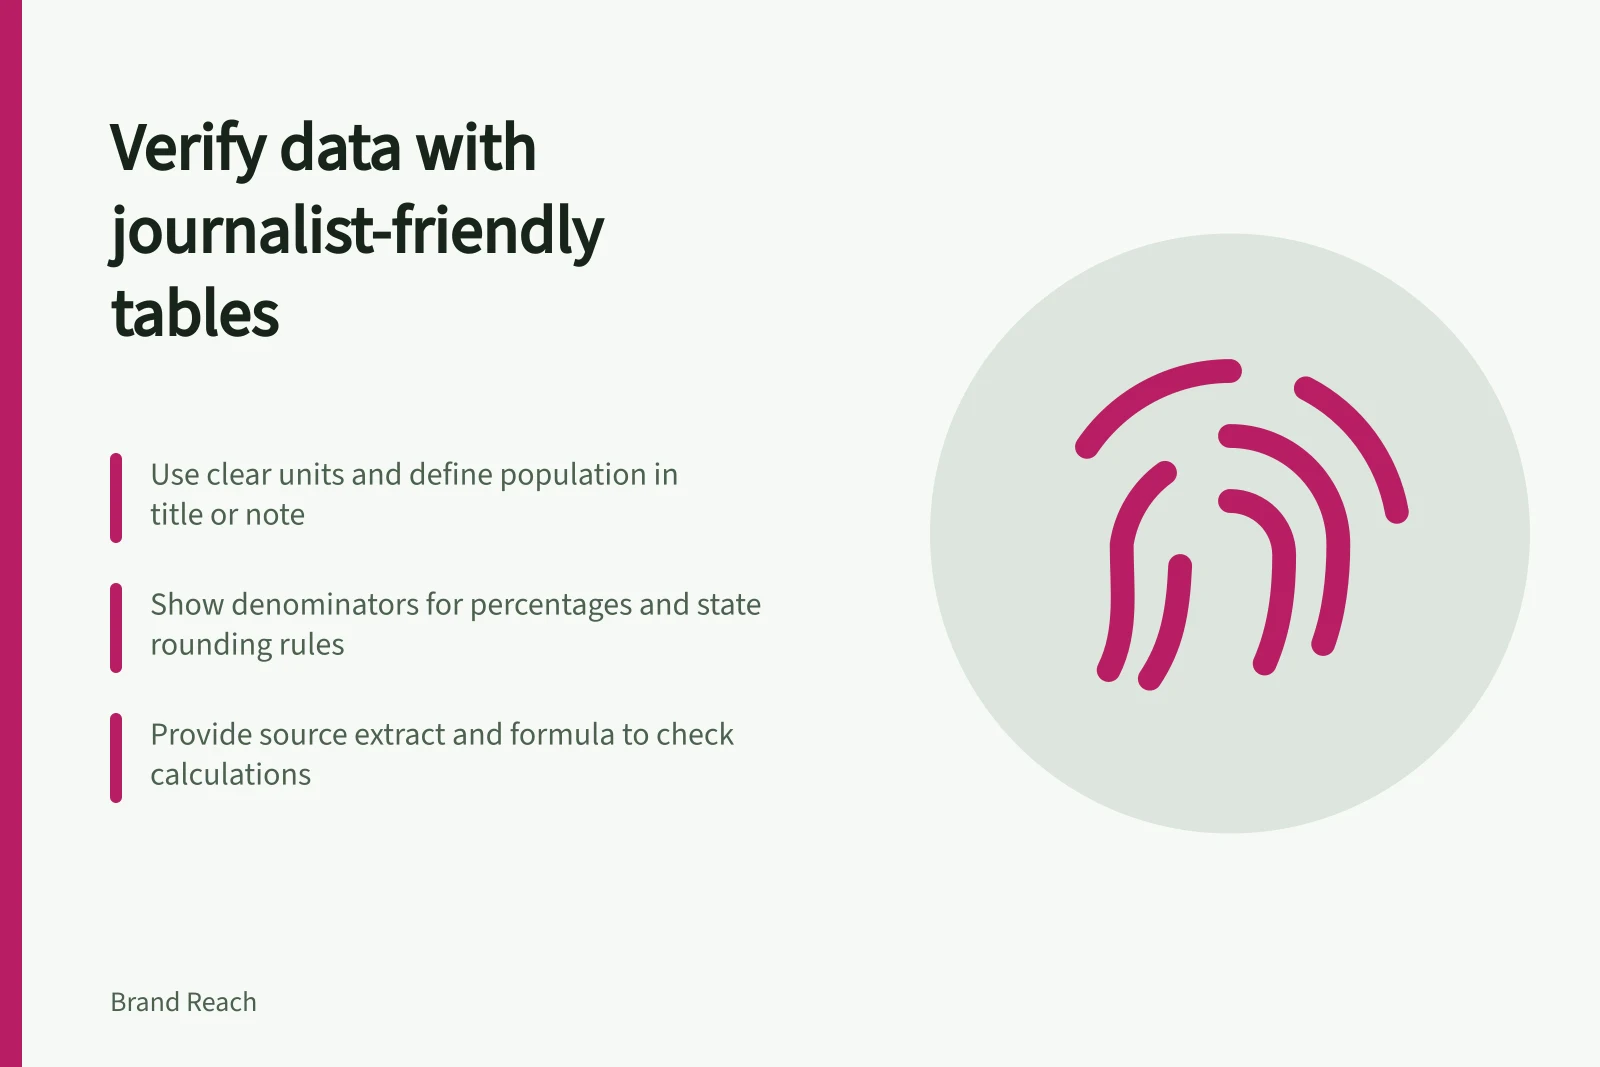
Write the claim first, then choose columns that let a reader check it. Use one clear unit per column and name the population and reference period in the title or note.
A copy-ready structure is: title = [population] and [reference period]; columns = [category], [value in unit] and, for percentages, [denominator]; note = [rounding rule], [cell-marker meanings] and [source citation].
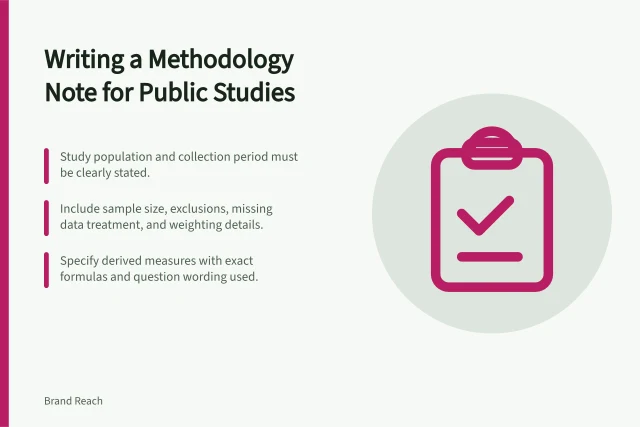
Show the denominator for percentages. If values are rounded, retain the unrounded working file internally and state the rounding rule.
Use distinct labels for missing and suppressed values, and write a zero as 0. Define the labels in a note so an empty cell cannot be mistaken for zero.
For public statistics, give the publication or dataset title and reference period so a reporter can identify the material being reused. Apply the same approach to an original survey or company dataset.
For an ABS webpage, a source note can follow this pattern: Australian Bureau of Statistics (June 2020) Australian National Accounts: National Income, Expenditure and Product [URL], ABS Website, accessed 11 December 2020. Include the access date because ABS content is designed to change over time; where a webpage URL contains a reference period, use that URL rather than a latest-release URL.
Key elements for a verifiable table
- Clear title
- [Population] and [Reference period]
- Unit consistency
- One clear unit per column
- Denominator for percentages
- Always included in table
- Rounding rule
- Stated in source note
- Source citation
- Publication title, reference period, URL, access date
Make the calculation checkable
Provide the source extract or an appropriately aggregated release file, plus a formula note for derived values. Record the filters and denominator used for the figure.
Ask someone who did not build the table to recreate one headline figure from the extract using the stated formula. If their result differs, check filters, duplicate records and denominator changes before sending the pack.
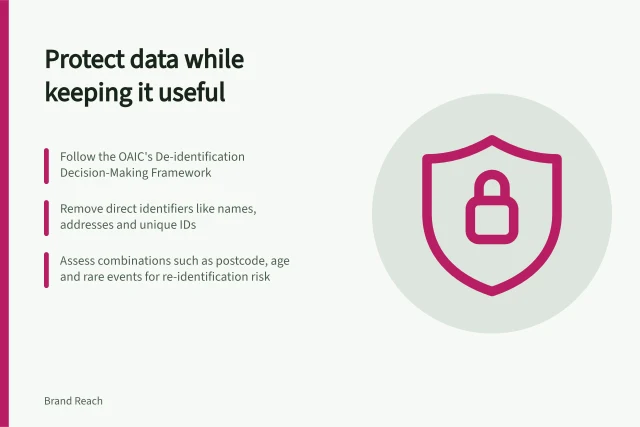
Do not include individual-level records merely to demonstrate transparency; assess disclosure and re-identification risk first.
Verification checklist for journalists
- Is the source extract provided?Yes
- Are filters and denominator documented?Yes
- Can a second person reproduce the headline figure?Yes
- No individual-level data included without privacy reviewYes
- Unrounded working file retained internallyYes
![Add source line to charts: Place source line directly below chart after export.; Use ABS format: Publisher (Period) Title [URL], accessed DD Month YYYY.; Cross-check all labels and values against the original data table. Preparing a chart with a visible source and date](/covers/preparing-a-chart-with-a-visible-source-and-date-640.webp?v=b9d93b7a)