
Original Research
Part of Data-led PR assets
Writing a methodology note for a public study: a guide
A methodology note tells a reader how a finding was produced and where its inference stops. It should be short enough to scan but complete enough that another …
A methodology note shows how a finding was produced and where its inference stops. Draft it so a reader can scan the population, collection and calculation, then judge whether the conclusion fits the evidence.
Include the decisive facts
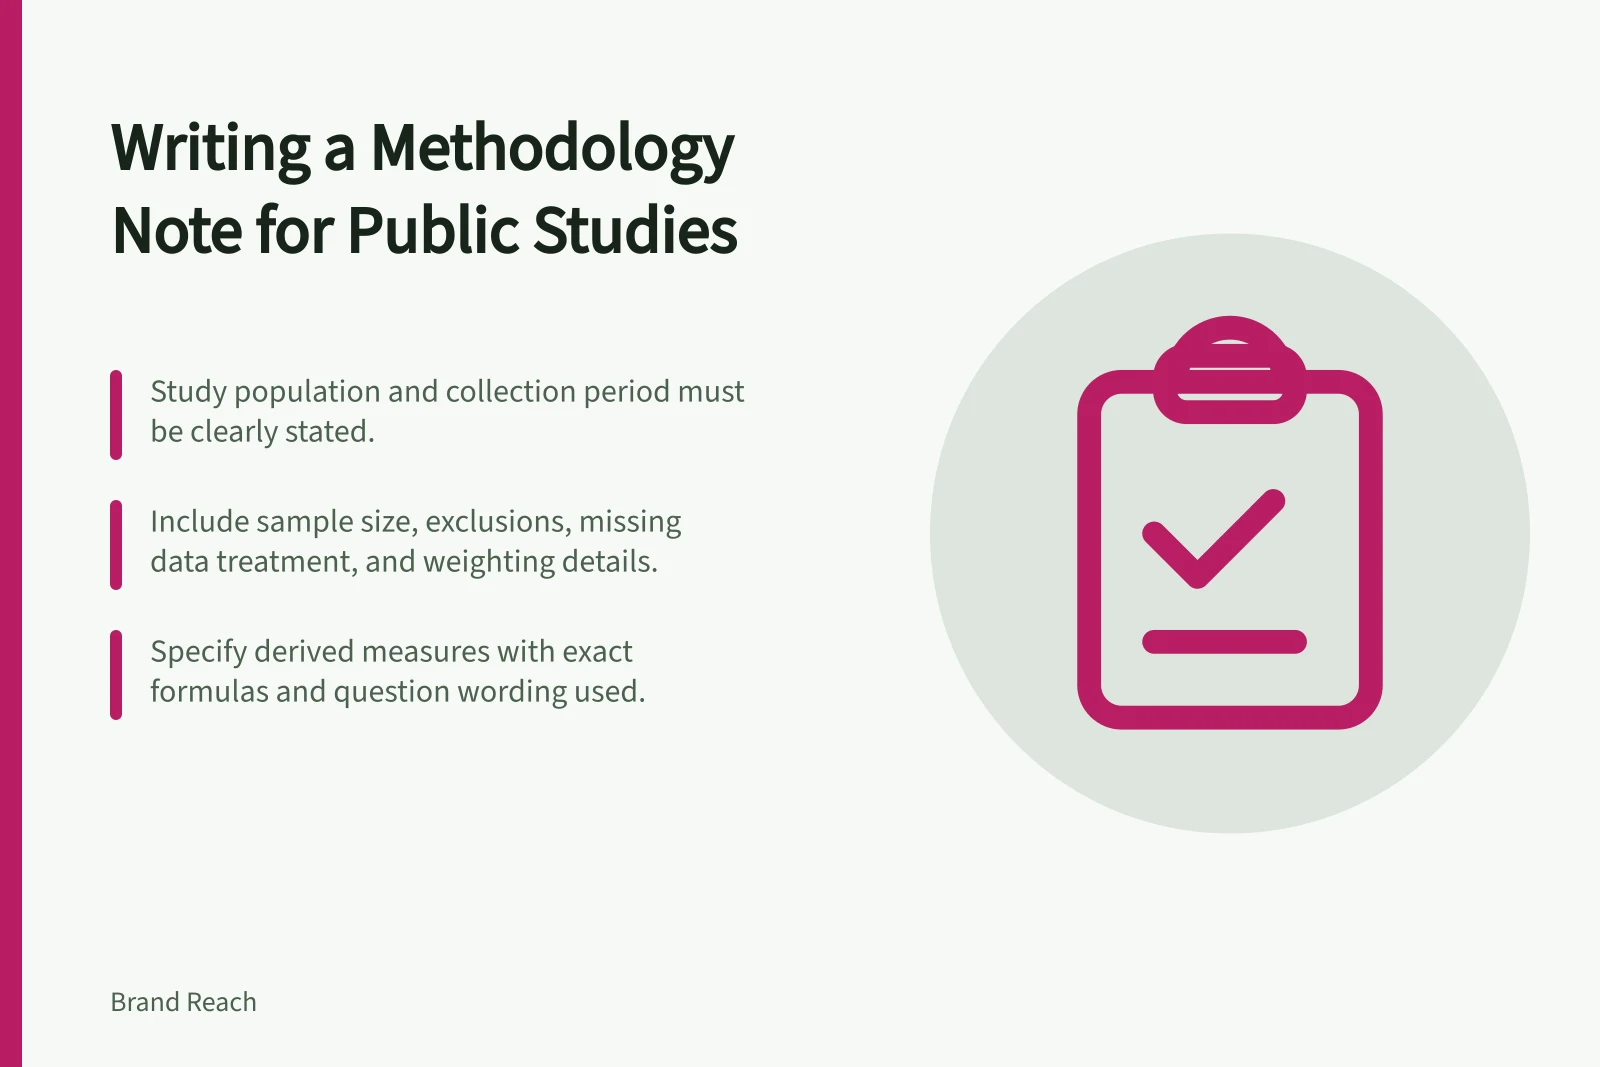
Write the note in this order: study population or subject and collection period; how cases entered the dataset; sample size, exclusions and missing responses; weighting and calculations; then any relevant question wording. This sequence lets a reader follow the study from its inputs to its results.
Use this as a fill-in skeleton: “The study examined [population or subject] during [period]. Cases entered the dataset through [collection method]; the sample included [number], with [exclusions] and [treatment of missing responses]. We [did or did not] weight the results. We calculated [derived measure] as [formula].” Replace every bracketed item with the study’s actual details.
Explain the difficult parts rather than naming them alone. If results were weighted, say how; describe what happened to missing responses; and give the formula for each derived measure. Include question wording when it affects how a measure should be understood.
For any chart or table, identify the method that produced its figures. For reused ABS statistics, identify the exact issue, reference period and table, and follow the Australian Bureau of Statistics guide How to cite ABS sources. Its suggested citation elements include the ABS, the reference period or year, the title, a URL and an access date; ABS content can change over time.
Essential elements for citing ABS statistics
- Source
- Australian Bureau of Statistics (ABS)
- Title
- Survey of Income and Housing, Australia
State what the study cannot show
If participants volunteered, do not imply that the result describes all Australians. If a comparison has no control, avoid causal language; state what the study design can support instead.
If responses were suppressed for privacy, describe the rule without exposing removed records. The Office of the Australian Information Commissioner’s De-identification and the Privacy Act is a relevant Australian reference.
Ask an independent reader to repeat one calculation and flag any statement that reaches beyond the sample. Use that check to tighten the note’s description of what the result can show.
What a methodology note can and cannot show
- Can showThe proportion of participants who reported a specific behaviour or opinion during a defined period
- Cannot showThat the result represents all Australians if the sample was self-selected or non-random
- Can showHow privacy protections were applied, such as suppression of low cell counts in tables
- Cannot showCausal relationships without a controlled experimental design or longitudinal analysis
![Add source line to charts: Place source line directly below chart after export.; Use ABS format: Publisher (Period) Title [URL], accessed DD Month YYYY.; Cross-check all labels and values against the original data table. Preparing a chart with a visible source and date](/covers/preparing-a-chart-with-a-visible-source-and-date-640.webp?v=b9d93b7a)